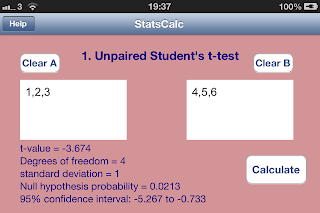
In landscape mode, when you swipe up, you obtain a pink display with various statistical tests, as below (you can watch the demo on http://www.youtube.com/watch?v=vwbfddgwDwo).
The paired/unpaired t-tests and the small sample hypothesis test are two-tailed as the Student-t distribution is symmetric, so the 95% confidence interval lies between the two tails, where the area of each tail is 0.025 (i.e. 2.5% of the total probability).
For the chi-squred test, the probability is asymmetric, as its support occurs for only positive values, so it is a one-tailed test (i.e. for the 95 % confidence interval, the single tail area is 0.05, hence 5% of the total probability). The x2 value is the chi-squared value, df is the degree of freedom (one less the number of categories), and the c2 parameter is the Critical Value. If the chi-squared value exceeds the critical value we reject the Null Hypothesis that the observed frequencies do come from the assumed distribution with the expected frequencies. Note that all expected frequencies need to be greater than 0.
A worked example of the chi-squared test is displayed in the screenshot below (the right box, Box B, needs to be populated with the expected frequencies while Box A needs to be populated by the observed frequencies - the number of degrees is 3):-
From the above screenshot, the chi squared value is much lower than the Critical value, so we accept the null hypothesis.
Note that the critical value for 3 degrees of freedom is 7.81473 - as a cross check, you can swipe down then swipe left/right to the chi-squared distribution, and enter 0.95 in the probability field, 0 in the lower limit, and 3 for the k parameter (i.e. the degrees of freedom), leaving the Upper Limit blank, finally pressing calculate
A worked example of the chi-squared test is displayed in the screenshot below (the right box, Box B, needs to be populated with the expected frequencies while Box A needs to be populated by the observed frequencies - the number of degrees is 3):-
The upper limit will be the critical value, and this is indeed the case. If you wanted a different confidence interval, say for 99%, you would enter 0.99 in the probability field, and obtain a new Critical Value against which to compare the chi squared value x2 with.


ReplyDeleteI was diagnosed with COPD four years ago and struggled with worsening symptoms despite using inhalers and medications. Last year, I tried a herbal treatment from NaturePath Herbal Clinic, and to my surprise, it made a huge difference. My breathing improved, the coughing eased, and my energy came back. I feel better than I have in years. If you're dealing with COPD, I highly recommend checking them out: www.naturepathherbalclinic.com.